Table
<gcds-table>
Also called: data table, data grid.
A table is a structured layout of related data in rows and columns.
-
GitHub -
Figma
Table component preview
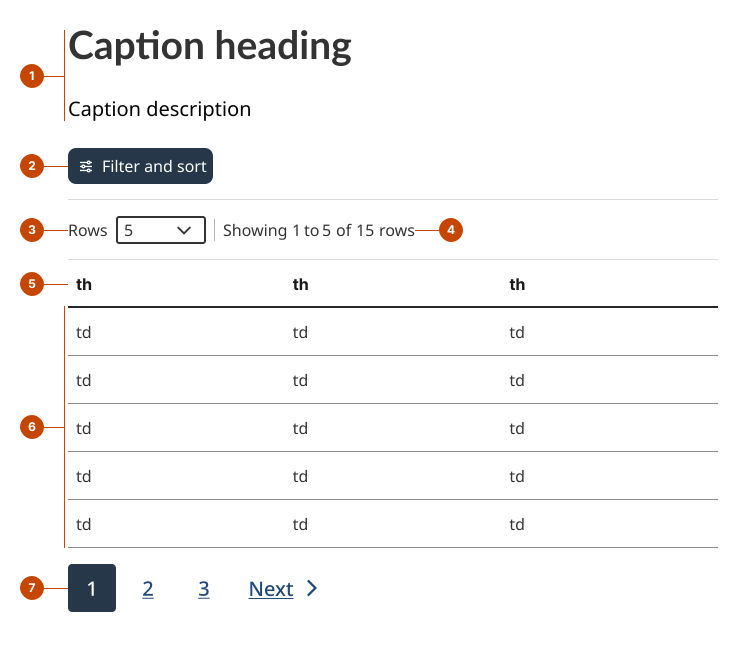
Table anatomy
- The caption labels the table’s purpose and gives context for the data presented.
- The filter and sort button (optional) opens an overlay that allows people to reorder and filter data.
- The row control (optional) lets people set the number of rows displayed per page.
- The display status shows the range of visible rows and the total number of rows.
- The column header is a title that describes the column’s data. It also acts as an interactive triggre to sort the data.
- The row is a horizontal group of cells representing a single item or record.
- Pagination (optional) lets people move between pages of a large dataset.
Design and accessibility for tables
Structure tables for clarity and simplicity
- Include at least one column header or row header so relationships between values are explicit.
- Order rows and columns in a way that fits how the information should be understood (for example, by chronology, by importance or by association).
- Avoid complex or nested tables whenever possible, as they are challenging for people using assistive technologies.
- Avoid merging or splitting cells.
- Avoid using more than one level of column or row header.
- Split complex tables into multiple simpler tables to make them easier to read.
- Add a caption to provide an accessible name to the table. Write unique captions for each table on the page so people using assistive technologies can distinguish them.
Format content to support scanning
- Use descriptive, concise table headers in a consistent format, such as noun phrases.
- Use consistent alignment so values can be compared quickly.
- Left-align text and non-quantitative numbers like dates, postal codes and phone numbers.
- Right-align numbers like quantities and measurements so their decimal points line up. Use the same number of decimals for all numbers.
- Align column headers with their column content.
- Place units in column headers instead of repeating them in each cell.
- Avoid long text in cells to help scanning across rows and columns.
- Avoid leaving cells blank as some assistive technologies may not communicate that a value is missing. Add context-specific text such as “Not applicable” or “No value”.
Support finding and exploring data
- Use filtering to help people narrow down results to a relevant subset when:
- The dataset is large enough that scanning all rows is difficult.
- People are likely to have a specific value or target in mind.
- Use sorting to help people reorganize data and find what matters most to them when:
- The order of rows affects how people interpret the data, such as by priority, recency, or magnitude.
- People may want to look for patterns across the dataset.
- Use pagination to help people navigate large datasets when:
- The number of rows would make the page too long to scroll comfortably.
- People are exploring items and do not need to see everything at once, or would benefit from faster-loading pages.
Help us improve
Have questions or a request? Give feedback on our contact form.
Something's wrong? Raise it through GitHub with an